It’s happened to most of us in one form or another. Your iOS app keeps crashing for no apparent reason, you can’t really reproduce it consistently, and it seems like it’s affecting older devices more often. If you’ve been in this situation, you probably witnessed first-hand the side-effects of memory leaks. But what are memory leaks and how do you plug them, and perhaps more importantly, how do you find them?
# What’s a memory leak?
A memory leak can occur when an allocated piece of memory isn’t properly deallocated and lingers about. Even though leaking a couple of bytes here and there doesn’t seem like a cause for much concern, it can rapidly snowball into a crash, as your app tries to retain more memory than the system will allow it.
This is why you should strive to properly manage your app’s memory.
If that’s not enough motivation, detecting memory leaks isn’t trivial, otherwise the system would do it for you and plug them accordingly. That doesn’t keep some languages from trying to do just that!
For instance
- Java uses the Garbage Collector to heuristically determine if a piece of memory can be safely deallocated after it is “no longer necessary”.
- Swift uses Automatic Reference Counting (ARC) to keep track of how many references exist for objects, which occupy memory.
On the other hand, we have languages such as C that force you to properly manage your app’s memory, else you risk having to debug it with software such as -shudder- Valgrind.
Let’s take a look at Swift’s ARC and how it works with a simple example. Every time an object gets referenced, its Reference Counter (RC) get incremented, conversely it is decremented when it no longer is referenced. (You can read more about this topic in the official documentation for ARC.)
import Foundation

class SomeClass: NSObject {}

var someInstance: SomeClass! = .init() // Create an instance - RC: 1
someInstance = nil // Remove the reference - RC: 0
var someInstance: SomeClass! = .init() // Create an instance - RC: 1
var someReference = someInstance // Reference the object somewhere else - RC: 2

someInstance = nil // Remove the one reference - RC: 1
someReference = nil // Remove the final reference - RC: 0
Now, what if have two objects that can reference each other, a Parent and a Child.
import Foundation

class Parent: NSObject {
    var child: Child!
}

class Child: NSObject {
    var parent: Parent!
}

var parent = Parent() // RC(parent): 1
var child = Child() // RC(child): 1

parent.child = child  // RC(child): 2
child.parent = parent  // RC(parent): 2

parent = nil  // RC(parent): 1
child = nil  // RC(child): 1
If at some later point in time you no longer need the child object and mark it up for deallocation with child = nil, you’d expect that parent.child would also become nil, but sadly that isn’t the case. As you can see, we can no longer access the parent and child instances, but there’s still a lingering reference for each. This is a memory leak!
# How do I plug a leak?
Keeping with the last example, we can plug this leak by properly cleaning up the lingering references before we deallocate the base objects.
var parent = Parent() // RC(parent): 1
var child = Child() // RC(child): 1

parent.child = child  // RC(child): 2
child.parent = parent  // RC(parent): 2

parent.child = nil  // RC(child): 1
child.parent = nil  // RC(parent): 1

parent = nil  // RC(parent): 0
child = nil  // RC(child): 0
As you might have noticed, this is only simple in these self-contained examples, once the codebase starts growing it will only get harder. Fortunately, there’s a way to simplify our code and ease our minds. weak references to the rescue!
So far we’ve been using what are called strong references (this is the default in swift), but we can explicitly use weak references such that lingering ones will be marked for deallocation automatically. This is because weak references don’t increment the ARC. Here’s how we can change our previous example so that we don’t have to worry about memory leaks.
class Parent: NSObject {
    weak var child: Child! // Notice the `weak` modifier!
}

class Child: NSObject {
    weak var parent: Parent! // Notice the `weak` modifier!
}

var parent = Parent() // RC(parent): 1
var child = Child() // RC(child): 1

parent.child = child  // RC(child): still 1, thanks to ARC
child.parent = parent  // RC(parent): still 1, thanks to ARC

parent = nil  // RC(parent): 0
child = nil  // RC(child): 0
So there you have it, you either take care of existing strong references and deallocate them carefully, or you use weak references which will deallocate objects for you if they become stranded. Do note that both approaches have their pros and cons, with none of them being a silver bullet for all your problems.
# How can I detect a memory leak before it crashes my app?
We’ve tackled what and how to avoid memory leaks, but how can we go about detecting them while they are happening other than by reviewing our code and hoping to stumble upon the solution?
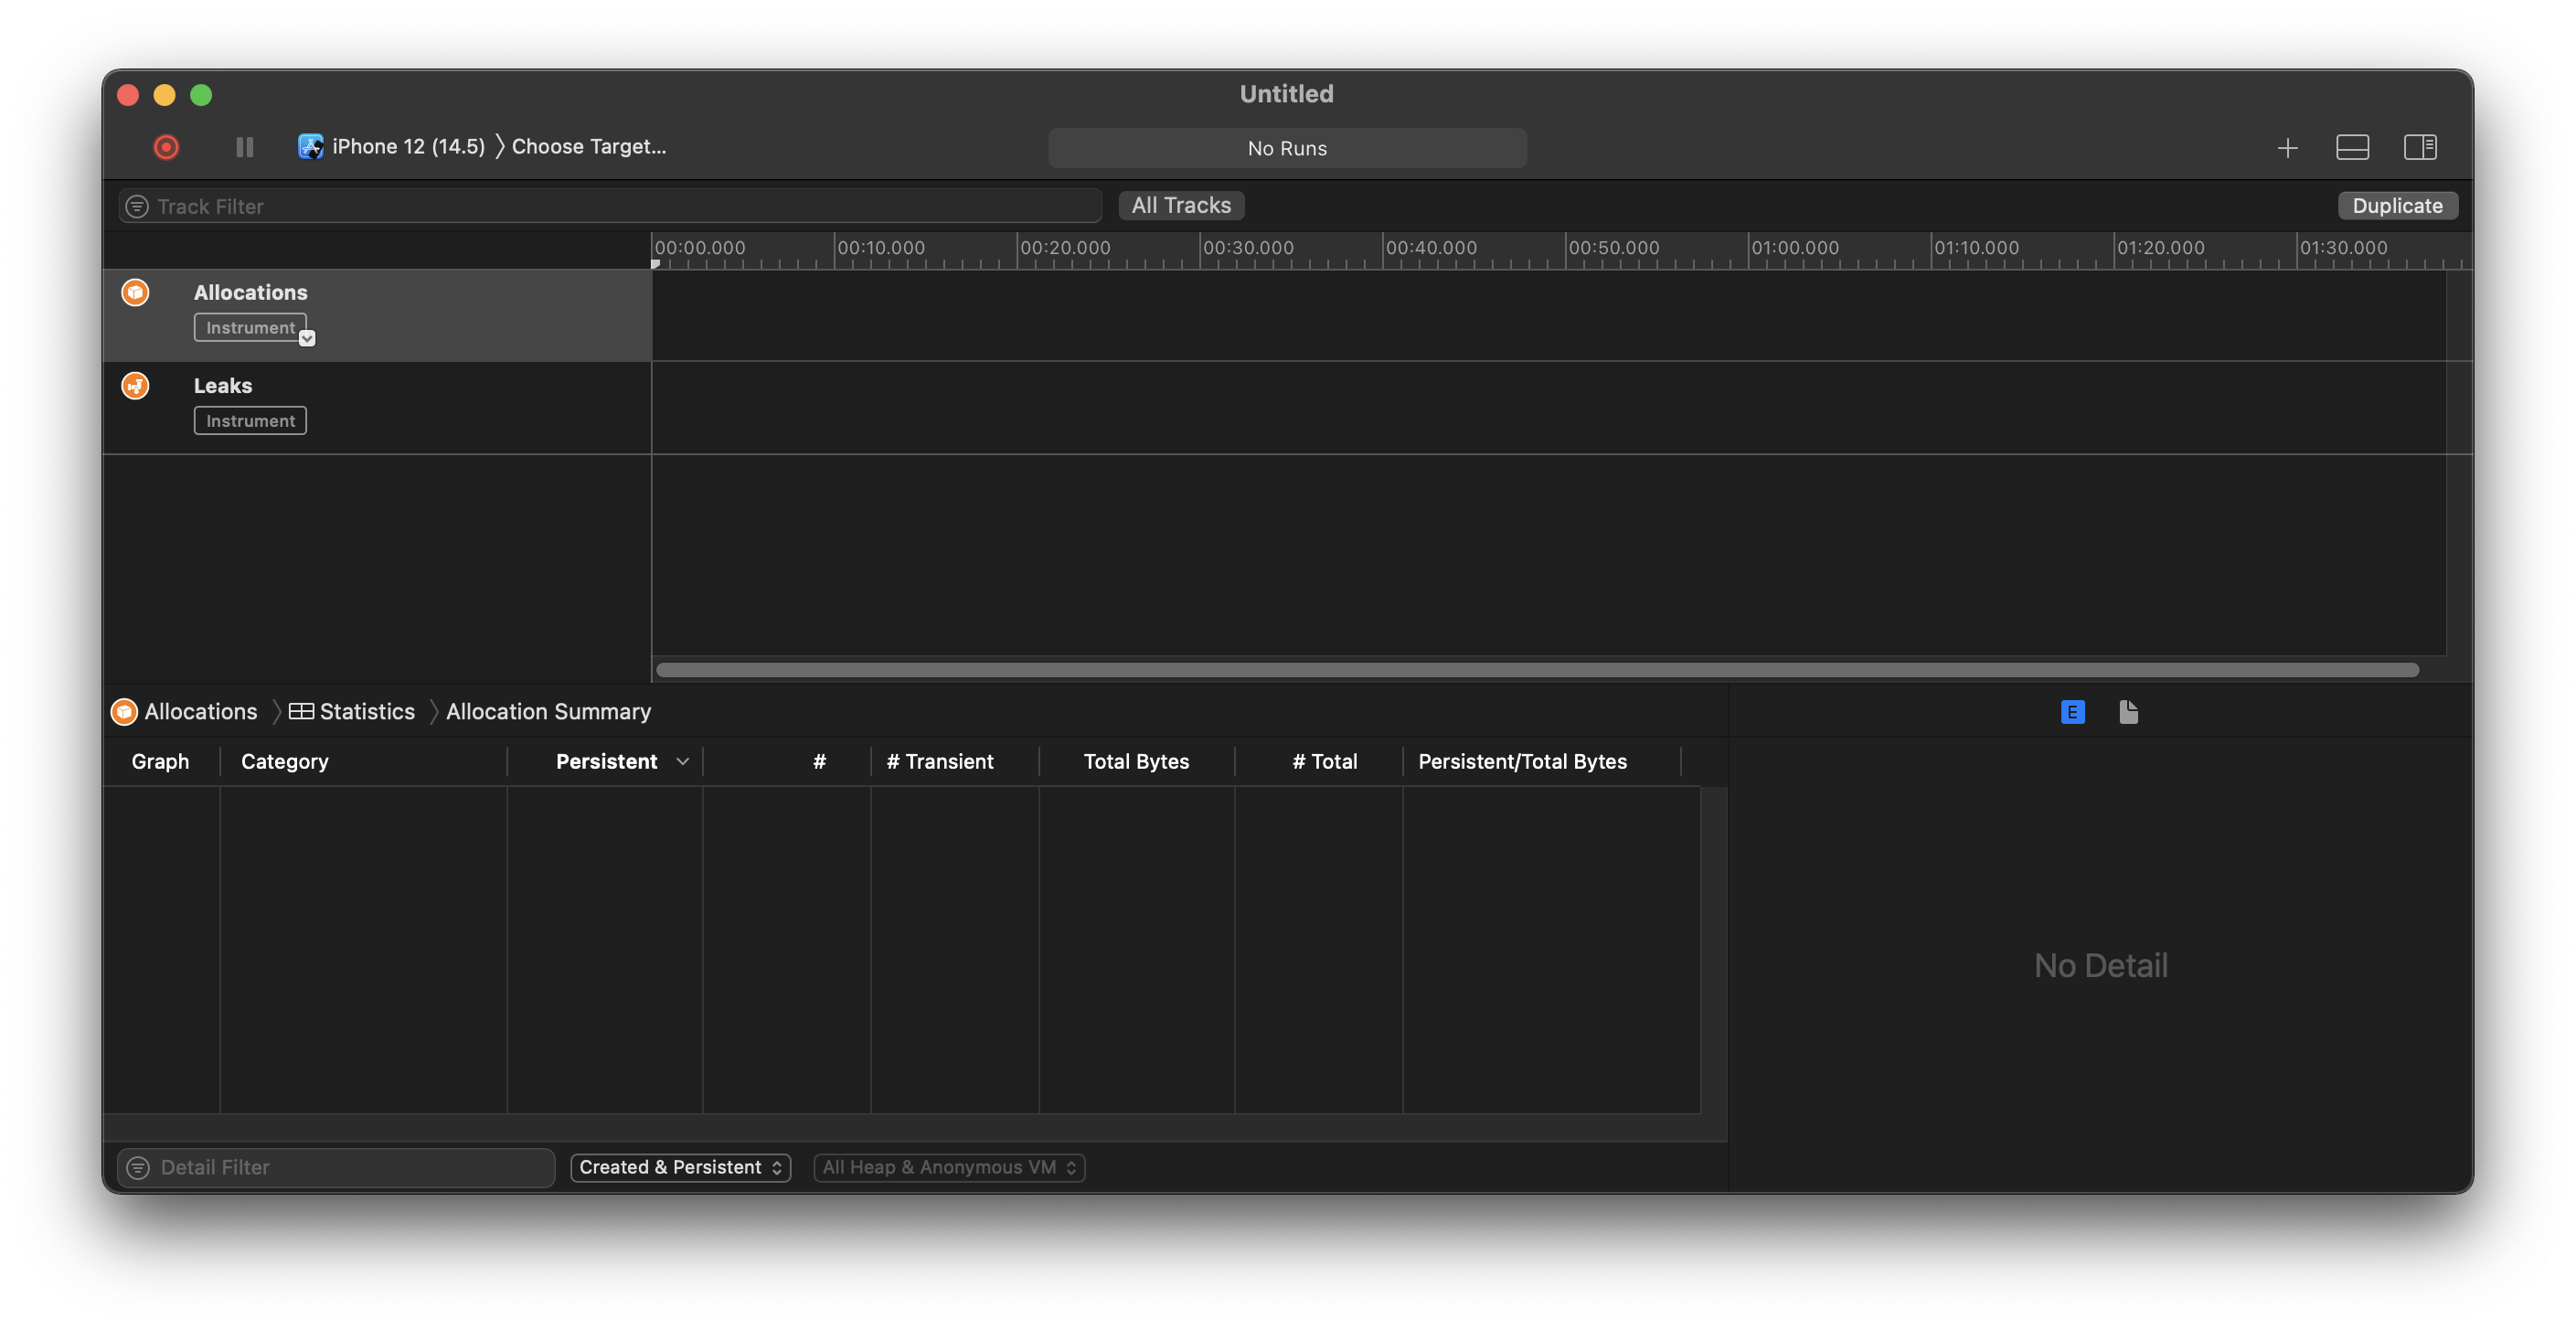
Xcode comes bundled with the “Instruments.app” suite of tools, one of which is the “Leaks” tool.
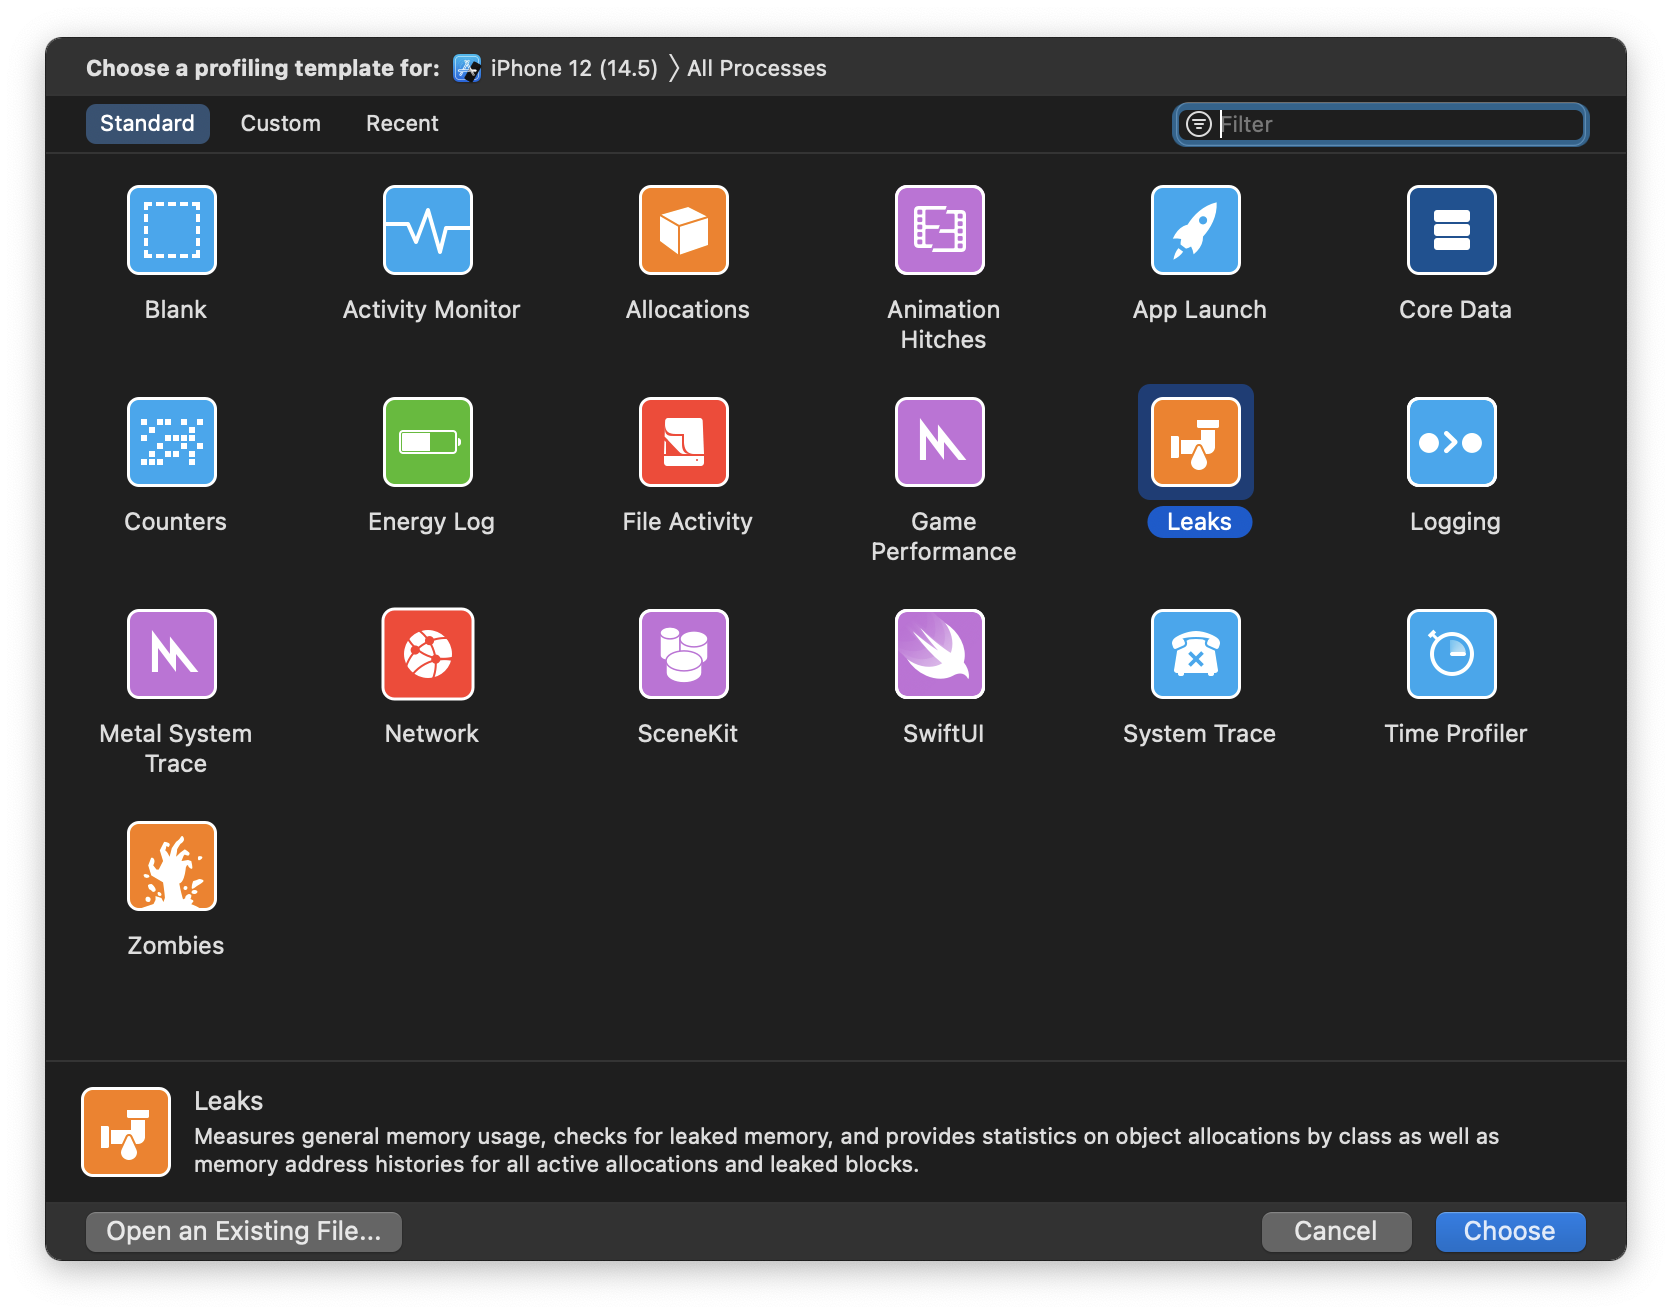
There’s plenty of good guides out there on how to use it (here’s one and the official guide), but the gist of it is that you monitor your running app with “Leaks” and lookout for
- the reported leak candidates
- unexpected surges in memory
- objects that never seem to get deallocated
On top of monitoring, you can also record and export the “Leak”’s session so that you can go over it later. Be mindful that although Leaks has pretty accurate reporting, it might not find more complex leaking scenarios. As we’ve discussed, if this was a trivial matter, the system would fix leaks for you.
# This sounds too troublesome, can it be automated?
As you can imagine, this manual process can become very cumbersome very quickly, and to my knowledge it’s not straightforward to automate this analysis using the “Leaks” instrument (it seems to be possible though). Another alternative would be to defer the analysis of your recordings using other tools or scripts (we’re gonna be using one later on).
While researching this topic, this article got me thinking of other tools and ways to automate memory leak detection. If you already have a large Unit and UI test bed then adding memory leaking detection could just be another cherry on top of your cake; and even if you don’t, adding them will definitely increase the robustness of your codebase, so it’s a win-win situation! So let’s do just that, let’s make our tests go the extra mile and report memory leaks for us.
Let’s use our previous leaking parent & child example and write some unit tests for it.
# Unit Test - Automated Leak Detection
import XCTest

class SampleLeakingTestCase: XCTestCase {

    // Notice that these are the leaking variants of our sample classes, they don't use `weak` references.
    class LeakingParent: NSObject {
        var child: LeakingChild!
    }

    class LeakingChild: NSObject {
        var parent: LeakingParent!
    }

    private var parentSUT: LeakingParent!
    private var childSUT: LeakingChild!

    override func setUp() {

        parentSUT = LeakingParent()
        childSUT = LeakingChild()

        parentSUT.child = childSUT
        childSUT.parent = parentSUT
    }

    override func tearDown() {

        parentSUT = nil
        childSUT = nil
    }

    func test_WithParentAndChildReferences_ShouldBeEqual() {

        XCTAssertEqual(parentSUT, childSUT.parent)
        XCTAssertEqual(childSUT, parentSUT.child)
    }

    func test_WithNilParent_ChildShouldNotRetainParentReference() {

        parentSUT = nil
        XCTAssertNil(childSUT.parent) // This assertion fails
    }

    func test_WithNilChild_ParentShouldNotRetainChildReference() {

        childSUT = nil
        XCTAssertNil(parentSUT.child) // This assertion fails
    }
}
This example illustrates our previous point about lingering references more vividly thanks to the failure of our assertions, but it isn’t very practical. As our codebase grows, it would be very tedious to write unit tests just to catch memory leaks. Is there a smarter way of going about it? Well, we’re already doing our due diligence and resetting our Subjects Under test (SUT) in between tests with tearDown(), so what if we use this to our advantage?
What if we create an utility class which every unit test inherits from and that checks which SUTs are leaking during tearDown? Here’s my proposal using reflection to iterate over the SUTs after they have been reset with = nil in tearDown().
class LeakCheckTestCase: XCTestCase {

    override func tearDown() {

        defer { super.tearDown() }

        let mirror = Mirror(reflecting: self)

        mirror.children.forEach { label, value in
            guard let propertyName = label else { return }

            // NOTE: If the value is something, e.g. not `nil` (a.k.a. not `Optional<Any>.none`),
            // then we have a potential leak.
            if case Optional<Any>.some(_) = value {
                XCTFail("\"\(propertyName)\" is a potential memory leak!")
            }
        }
    }
}

class SampleNonLeakingTestCase: LeakCheckTestCase {
    // ...

    override func tearDown() {

        // Make sure that our memory leak inspection is the last thing to happen
        defer { super.tearDown() }

        parentSUT = nil
        childSUT = nil
    }

    // ...
}
Now we don’t need to have specific test cases to search for memory leaks, they will be an automated part of any unit test class that inherits from LeakCheckTestCase, as long as we don’t forget to clean our SUTs in tearDown() and defer { super.tearDown() }.
# UI Test - Automated Leak Detection
Can we do something similar with UI tests? Sure, but instead of executing our leak detection at the end of each test, we are going to do it continuously at the end of each step of our UI tests. We can accomplish this if we map our tests’ steps as named descriptions and closures to be executed. Then we just need to check if any leaks were detected and fail the UI test accordingly. This allows us to pinpoint what set of actions is causing the leak to happen.
As we’ve mentioned before, there are a couple of tools similar to the “Leaks” instrument that might be able to help us. LifetimeTracker is one such tool, intended for development and QA purposes, it will alert the user of detected memory leaks while using the app with an overlay. Finally, we can search the UI for its leaks summary report.
class UITestCase: XCTestCase {

    typealias Step = () -> Void
    var steps = [String: Step]()

    let app = XCUIApplication()

    func createStep(withName name: String, _ step: @escaping Step) {
        steps[name] = step
    }

    func executeStep(withName name: String) {

        // Find block of code for step and execute it as a part of the test
        XCTContext.runActivity(named: name) {
            guard let step = steps[name] else {
                fatalError("No step named \'\(name)\'")
            }
            step()
        }

        // Check for memory leaks at the end of each step
        let leaksSummary = app.staticTexts["LifetimeTracker.summaryLabel"].firstMatch
        if leaksSummary.exists {
            XCTAssertEqual(leaksSummary.label, "No issues detected")
        }
    }
}

class LeakingUITest: UITestCase {

    override func setUp() {
        createStep(withName: "Check prompt exists") {
            XCTAssert(app.staticTexts["Some prompt"].exists)
        }

        // Assume that tapping the button has the unintended side-effect of creating a memory leak
        createStep(withName: "Tap button and expected outcome happens") {
            app.buttons["Some button"].tap()
            XCTAssert(app.staticTexts["Some expected outcome"].exists)
        }
    }

    func testExample() {
        executeStep(withName: "Check prompt exists")
        // In this scenario, this test would fail on the following line
        executeStep(withName: "Tap button and expected outcome happens")
    }
}
# Final notes
Regarding the wizardry behind if case Optional<Any>.some(_) = value {...}:
Mirror.Childis defined as(label: String?, value: Any)in the official documentation.- This weird syntax is due to the fact that
valueis a non-optionalAnywhich can benil, even though it does not conform to Optional! So<nil Any> == nilreturns true or won’t even compile, depending on how it’s done. This is by design, so thatAnycan be used as a wildcard in swift, but in this case this wild card is coming to bite us in the ass. - So we use this roundabout
casecomparison using the optional protocol to make the compiler happy and get it to work. I’ve also seen it done usingString(describing: <nil Any>) == "nil", but it feels even more hacky. - Moreover, if you are using SwiftLint (as you should!), it attempts to fix
Optional<Any>.noneasAny?.nonebut the compiler doesn’t like that, so we disable the rule just this once.
// swiftlint:disable:next syntactic_sugar
if case Optional<Any>.some(_) = value {
Regarding weak references:
- As a rule of thumb, if your object’s lifetime is tied to others (cyclic or nested references) you are probably safer using weak references instead of trying to cover all flows and how to properly deallocate the object at the end of them. Another common use case for weak references is asynchronous programming, where the lifetime of your references is not linearly tied, e.g. you reference an object in another thread, but the base object gets deallocated before the thread actually gets to execute.
- This post wouldn’t feel complete if I didn’t mention that there are also
unownedreferences. These have all of the benefits ofweakreferences without any of theOptionalside effects; which is to say that they won’t increment the ARC but can’t becomenilduring their lifetime. They are a really nice piece of syntactic sugar when you are dealing withself-capturing closures.
Regarding using LifetimeTracker, just having it enabled with it’s .visibleWithIssuesDetected mode during development will already be a big improvement. Using it as part of our UI tests is just an added precaution for continuous integration purposes.
# Sources
- https://docs.swift.org/swift-book/LanguageGuide/AutomaticReferenceCounting.html
- https://betterprogramming.pub/diagnose-memory-leaks-using-xcode-instruments-5692a6458020
- https://developer.apple.com/documentation/xcode/making-changes-to-reduce-memory-use
- https://help.apple.com/instruments/mac/10.0/#/dev022f987b
- https://levelup.gitconnected.com/detecting-memory-leaks-using-unit-tests-in-swift-c37533e8ee4a
- https://useyourloaf.com/blog/xcode-visual-memory-debugger/
- https://stackoverflow.com/a/4819139
- https://blogs.halodoc.io/memgraph-detection-of-memory-issues-on-ios/
- https://dr-rost.medium.com/detect-memory-leaks-on-macos-4cf257529aa
- https://developer.apple.com/documentation/xctest/xctestcase/understanding_setup_and_teardown_for_test_methods
- https://tech.showmax.com/2019/02/automated-mem-leak-testing-ios/
- https://medium.com/flawless-app-stories/memory-leaks-in-swift-bfd5f95f3a74
- https://github.com/krzysztofzablocki/LifetimeTracker
- https://www.swiftbysundell.com/articles/using-unit-tests-to-identify-avoid-memory-leaks-in-swift/
- https://sceel.io/reflection-in-swift-5/
- https://www.swiftbysundell.com/articles/reflection-in-swift/
- https://developer.apple.com/documentation/swift/mirror